Matplotlib Pyplot Gallery
For more information on using matplotlib, visit the website.
For more information about making good figures, read Ten Simple Rules for Better Figures.
Matplotlib Basics
The basics of generating a plot look like this.
import matplotlib.pyplot as plt

fig, ax = plt.subplots()
ax.set_title("Descriptive Title Here")
#Your code goes here
fig.savefig("plot.png")
plt.close(fig)
Generating axes
| |
|
fig, ax = plt.subplots() |
Generate a new figure, with one blank axis to plot on. |
fig, (ax1, ax2) = plt.subplots(nrows=2) |
Generate a new figure, with two blank axes side-by-side. |
fig, (ax1, ax2) = plt.subplots(ncols=2) |
Generate a new figure, with two blank axes stacked. |
fig, axes = plt.subplots(nrows=3, ncols=2) |
Generate a new figure, 2 wide by 3 tall. |
fig, ax = plt.subplots(figsize=(8,6)) |
Generate a new figure, 8 inches wide by 6 inches tall. |
Working with labels
| |
|
fig.suptitle("Text") |
Set the title of the whole figure to “Text” |
ax.set_title("Text") |
Set the title of the subplot to “Text” |
ax.set_xticks(list_of_positions) |
Specify where you want the tick marks to show up |
ax.set_yticks(list_of_positions) |
Specify where you want the tick marks to show up |
ax.set_xticklabels(list_of_labels) |
Specify the labels that show up at each tick mark |
ax.set_yticklabels(list_of_labels) |
Specify the labels that show up at each tick mark |
ax.set_xlabel("Text") |
Label the x-axis “Text” |
ax.set_ylabel("Text") |
Label the y-axis “Text” |
Additional objects
| |
|
cbar = fig.colorbar(im, ax=ax, cmap='RdBu') |
Add a colorbar next to ax, scaled to the values in plot im, colored according to the colormap RdBu |
l = ax.legend(loc="upper right") |
Add a legend of the labeled objects in the plot to the upper right corner of ax |
Finishing a plot
| |
|
fig.show() |
Open an interactive window of your plot. |
fig.savefig("plot.png") |
Save your plot to the file plot.png. It detects the filetype based on the extension, e.g. png, pdf, ps, svg. |
plt.close(fig) |
Closes your plot, freeing memory. |
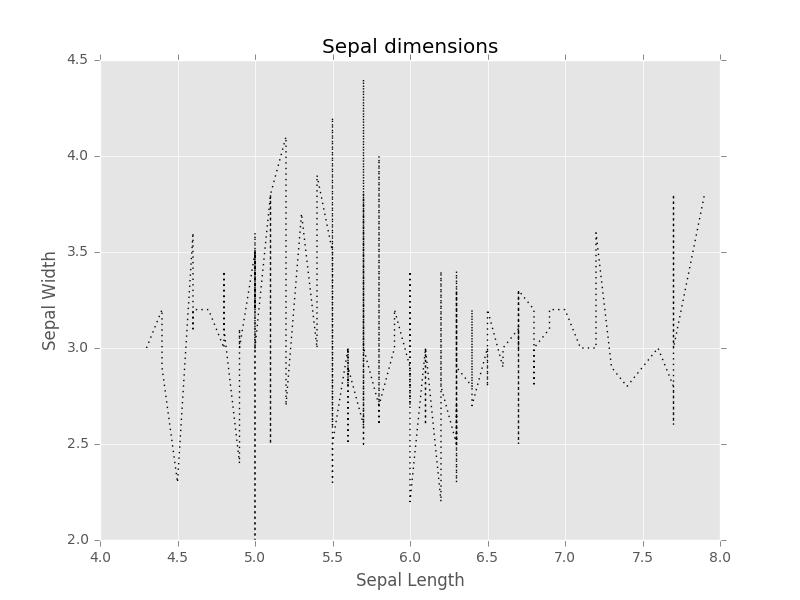
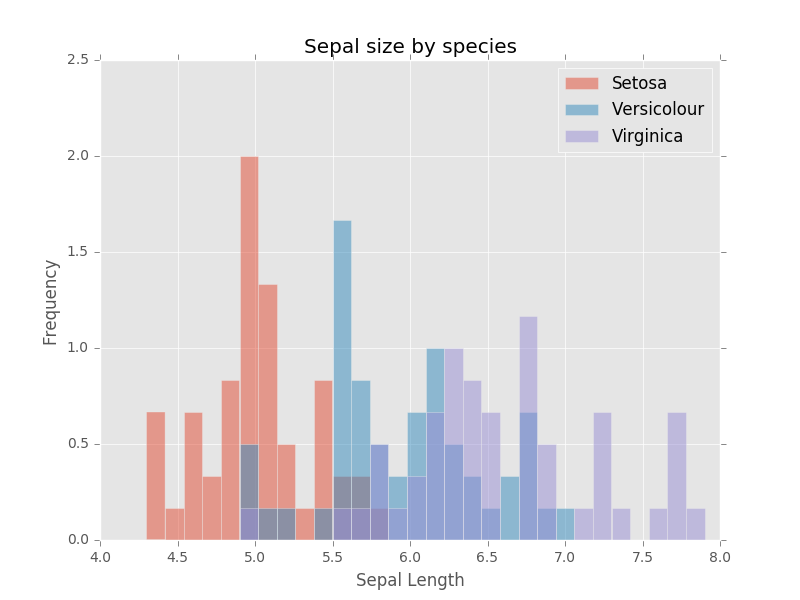
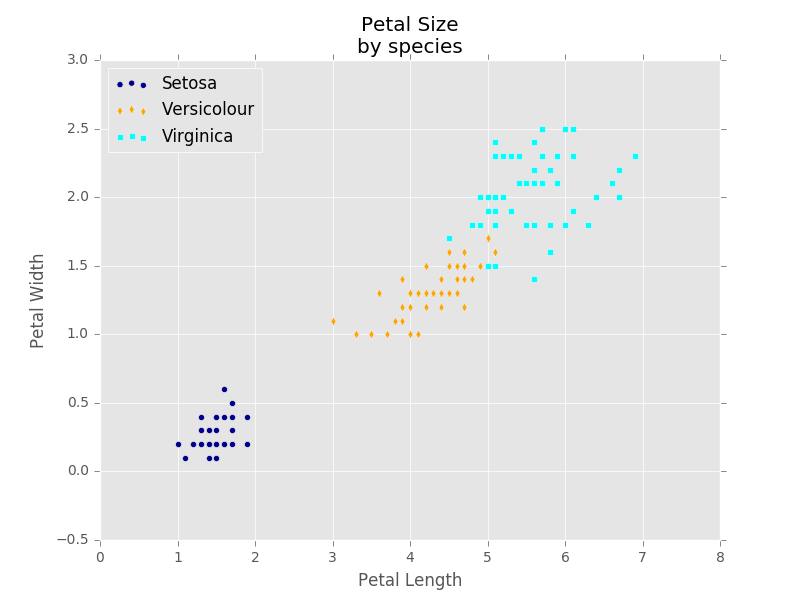
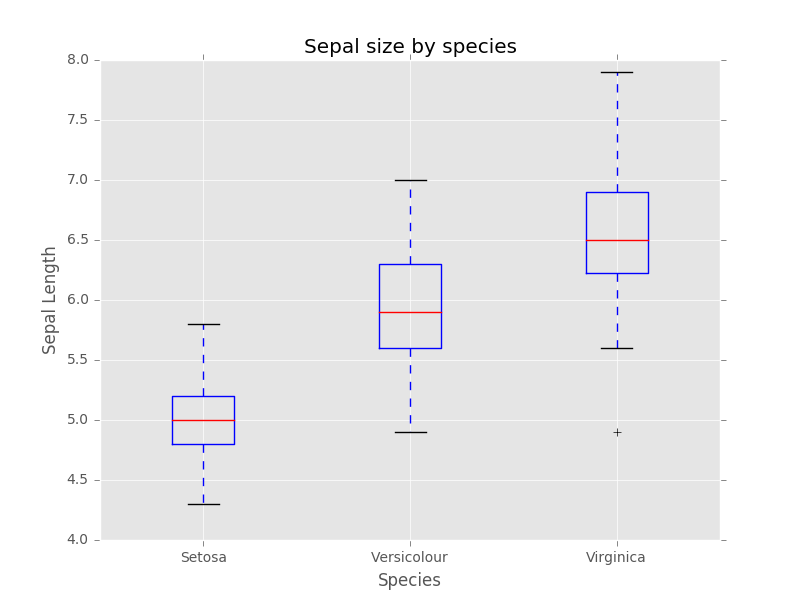
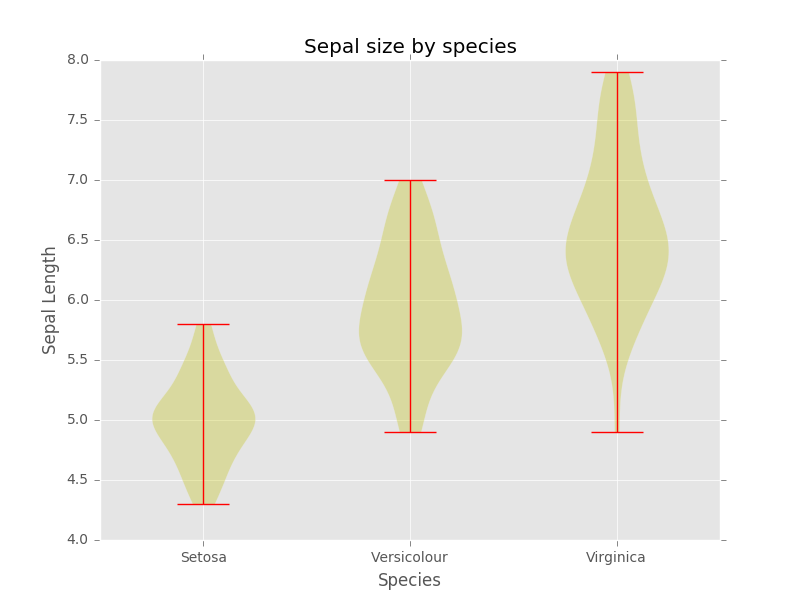
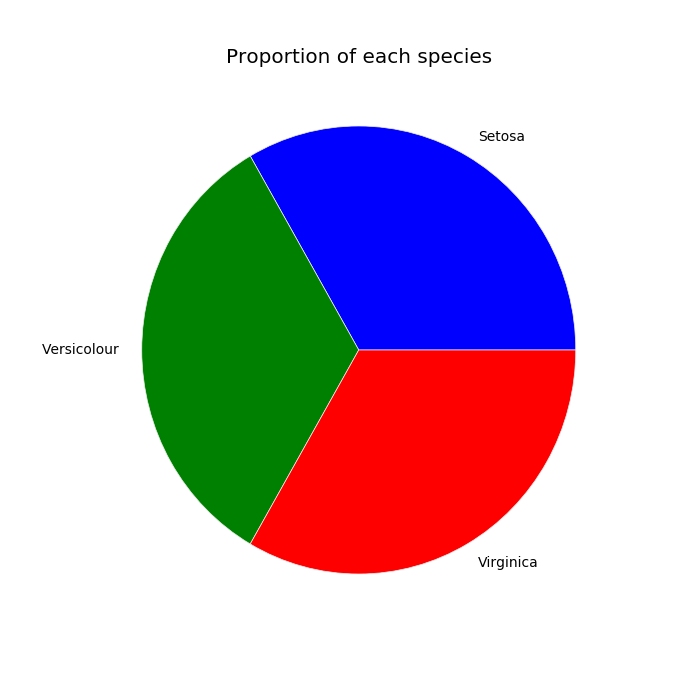
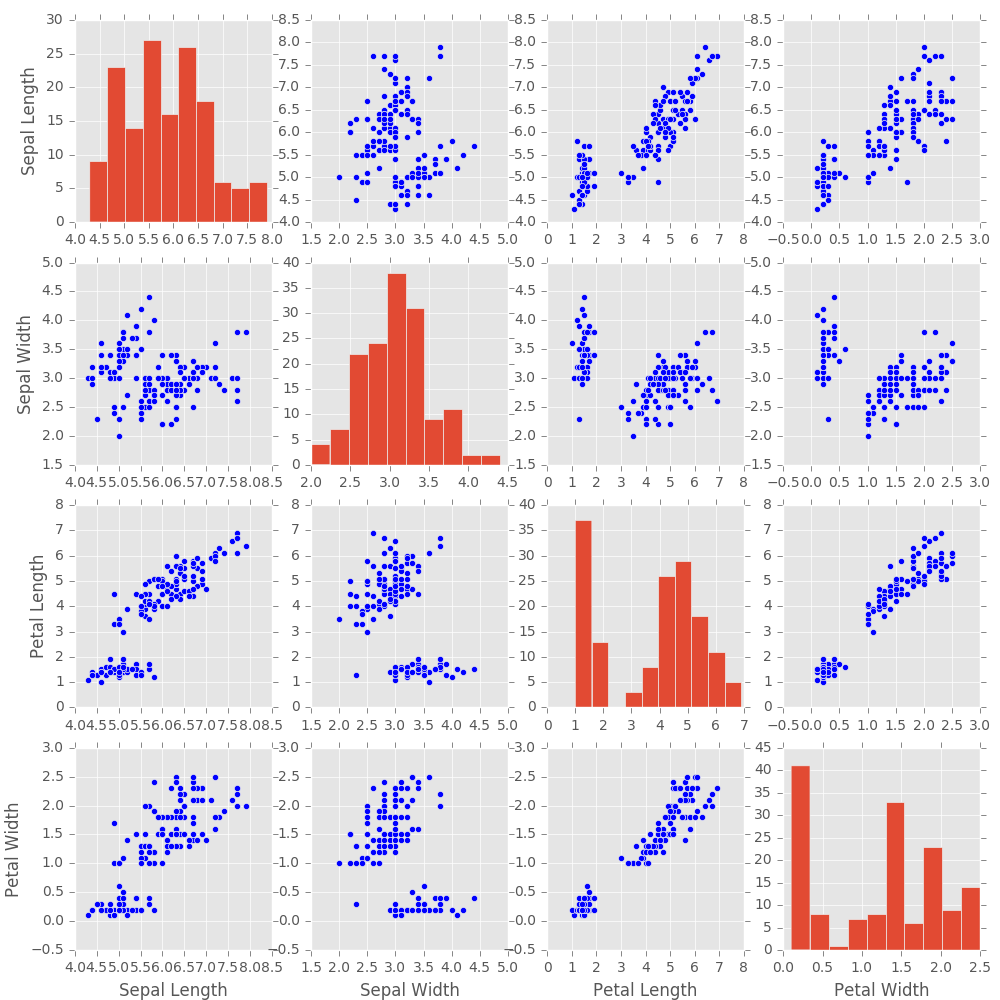
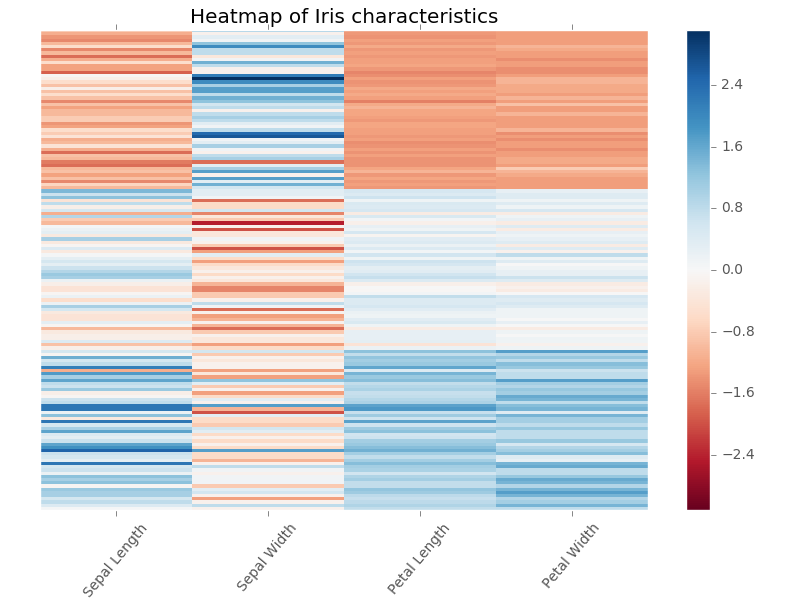
Gallery
This gallery contains the code to create example plots of the following kinds: